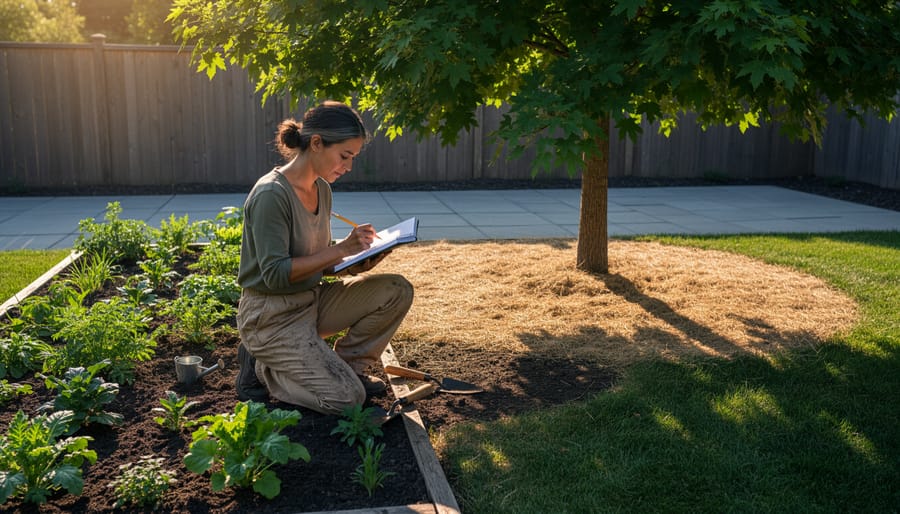
Walk your garden at different times of day with a notebook, recording where shadows fall, which areas stay damp after watering, and where wind whips through or air sits still. This simple practice reveals the hidden patterns that determine whether your tomatoes thrive or your hostas scorch.
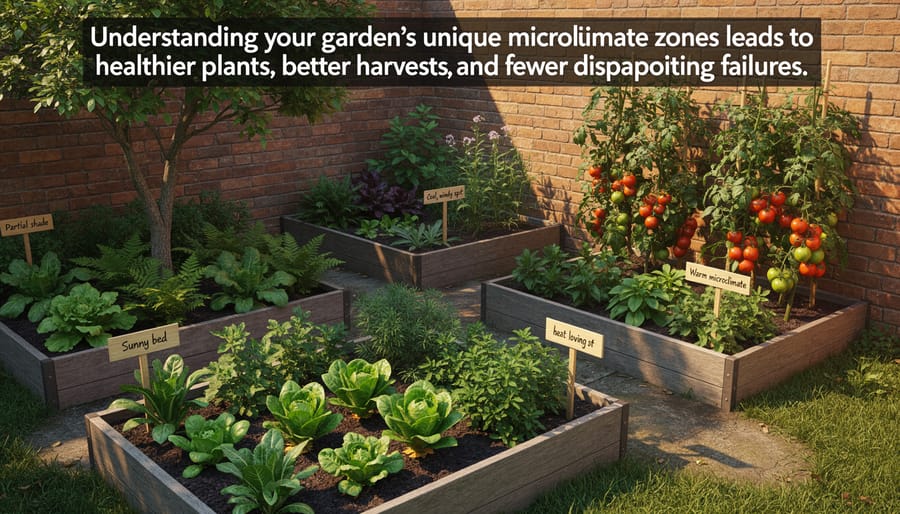
Every garden contains dozens of microclimates—small zones where conditions differ dramatically from spots just a few feet away. That shaded corner near your fence might stay ten degrees cooler than your sunny patio bed. The area beneath your maple tree creates a rain shadow where soil stays bone-dry even after storms. Understanding these variations transforms guesswork into strategy, turning plant failures into predictable successes.
Garden mapping gives you a visual record of these invisible forces. Instead of wondering why your lavender rotted in one spot but flourished in another, you’ll know exactly which areas offer the sharp drainage Mediterranean plants demand. You’ll stop fighting against your garden’s natural conditions and start working with them.
The process doesn’t require fancy equipment or technical expertise. You don’t need soil testing kits or weather stations to get started, though those tools can add helpful detail later. What you need is observation, a willingness to spend time in your space across different seasons, and a method for recording what you discover.
This approach works beautifully alongside beginner-friendly garden planning, giving you the foundational knowledge to make smart choices from your very first plantings. Whether you’re starting fresh or troubleshooting an established garden, mapping reveals opportunities you’ve been missing and explains mysteries you’ve been puzzling over for years.
What Is Garden Mapping and Why Your Plants Need It
Garden mapping is simply the practice of documenting and understanding the different conditions that exist throughout your garden space. Think of it as creating a personalized guide to your yard’s unique personality. You’re recording the physical features like buildings, fences, and trees, along with the environmental conditions that make each corner of your garden special.
Here’s something many gardeners discover the hard way: that sunny spot where your tomatoes thrived last year might be completely different from the supposedly identical sunny spot just ten feet away. This is where microclimate mapping comes into play, and it’s genuinely eye-opening.
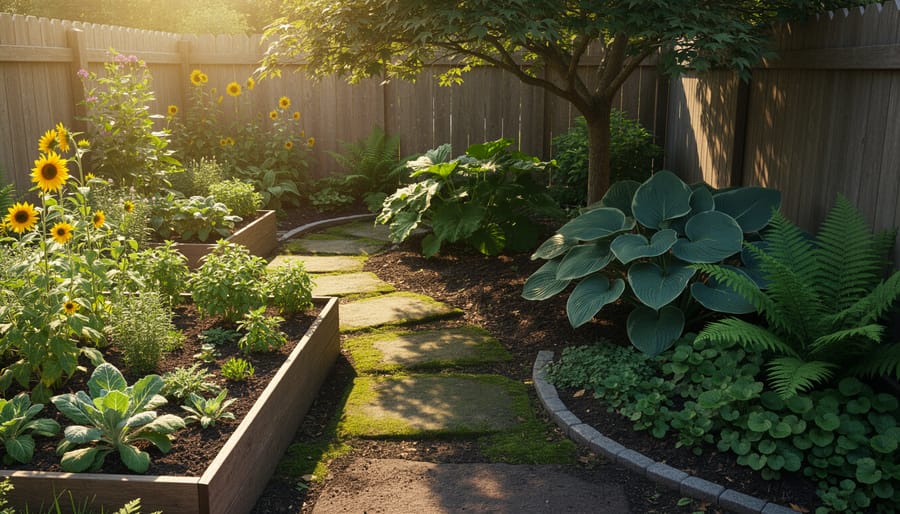
Even in a modest backyard, you’ll find surprising variations in temperature, sunlight exposure, moisture levels, and wind patterns. The south-facing wall of your house creates a warm pocket that might stay frost-free weeks longer than the open lawn. That shaded area under your maple tree isn’t just cooler—it likely has different soil moisture and even slightly different humidity. The corner where two fences meet might be a wind tunnel or a perfectly calm refuge, depending on your property’s orientation.
These microclimates explain so many gardening mysteries. Why do your hostas flourish in one shady spot but struggle in another that looks identical? Why does one section of your vegetable garden consistently outperform the rest? The answer lies in these subtle but significant environmental differences.
By mapping these variations, you’re essentially learning to speak your garden’s language. You’ll discover which plants naturally belong in each microclimate, rather than fighting against conditions that doom certain plants from the start. That lavender that keeps rotting? It probably needs that drier, warmer microclimate near your driveway. Those struggling ferns? They’d thrive in that cool, moist spot behind the shed.
Garden mapping transforms guesswork into informed decisions, turning frustrating failures into predictable successes. It’s not complicated—just observant, intentional gardening that respects what your space is already telling you.
The Five Microclimate Factors That Make or Break Your Garden
Sunlight Patterns: More Than Just Full Sun or Shade
Understanding your garden’s sunlight is trickier than simply labeling spots as sunny or shady. Light shifts dramatically throughout the day and changes with the seasons as the sun’s arc moves higher in summer and lower in winter.
I learned this the hard way when my supposedly full-sun tomatoes languished because an afternoon shadow I hadn’t noticed cut their light short. Now I map sunlight by checking the same spots hourly on a typical day, noting when direct sun hits each area. I sketch this on my garden map using different colors for morning, midday, and afternoon sun.
Don’t forget about reflected light, which can be surprisingly powerful. South-facing white walls bounce significant light and heat onto nearby beds, effectively creating warmer microclimates. I once grew heat-loving peppers beautifully in a spot that technically got only five hours of direct sun, thanks to a reflective fence.
For seasonal changes, photograph your garden on the solstices and equinoxes. That oak tree providing welcome summer shade might block precious winter light from cold frames. These patterns reveal the best placement for each plant’s specific needs, turning guesswork into informed decisions that actually work.
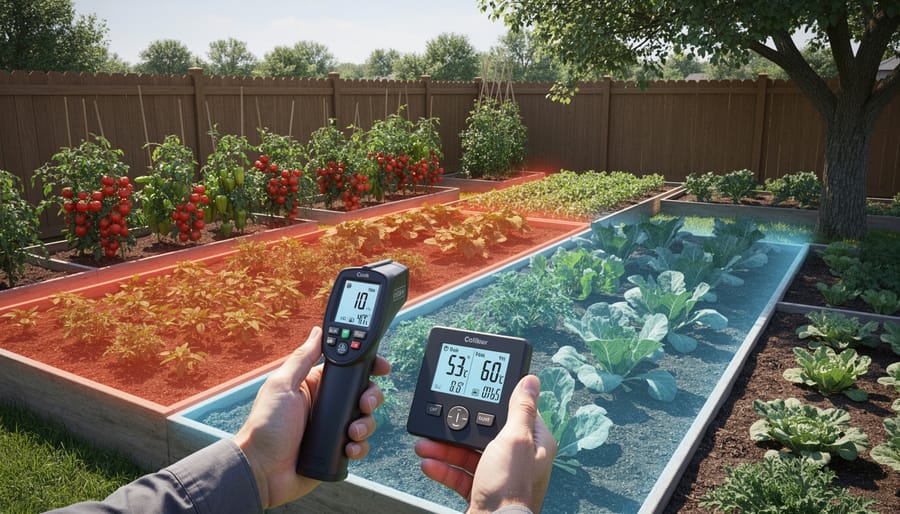
Temperature Zones: Finding Your Garden’s Hot and Cold Spots
Your garden experiences fascinating temperature variations, sometimes within just a few feet! Understanding these hot and cold spots can transform your planting success.
Start by identifying frost pockets, those low-lying areas where cold air settles on chilly nights. I learned this lesson the hard way when my tomatoes in a sunken bed froze while those on higher ground thrived. Walk your garden early on cool mornings with a thermometer and note where frost lingers longest.
Next, look for heat sinks, those sun-soaked surfaces that absorb warmth during the day and radiate it at night. South-facing walls, large rocks, and paved areas create cozy microclimates perfect for heat-loving plants like peppers and eggplants. I’ve successfully grown basil well into fall beside my brick wall.
Don’t overlook thermal mass effects. Water features, stone pathways, and even dense plantings moderate temperature swings. Mark these areas on your map with different colors representing warmer and cooler zones. This knowledge helps you match plants to their ideal spots, extending your growing season and reducing disappointing losses.
Wind Exposure: Mapping Your Garden’s Breezy and Sheltered Areas
Wind patterns can make or break your garden’s success, so let’s map those breezy and calm spots together. Start by observing your garden on several windy days, noting which areas get buffeted and which stay peaceful. Buildings, fences, and hedges create wind tunnels or shelter, dramatically affecting plant health and moisture levels.
I like walking my garden with ribbon strips tied to stakes, placing them in different zones. After a few hours on a breezy day, you’ll clearly see which areas experience constant wind versus calm pockets. Those exposed spots will dry out faster and stress tender plants, while sheltered zones might trap humidity or frost.
Master gardener Elena Torres shared with me that she maps wind patterns seasonally, since winter winds differ from summer breezes. “Understanding these shifts helped me position windbreaks strategically,” she explained. Mark windy zones with red on your map and sheltered areas in green. This information guides where you’ll plant fragile seedlings versus hardy perennials, and where extra mulching or watering becomes necessary.
Moisture Patterns: Where Water Pools, Drains, and Evaporates
Understanding water movement in your garden is like reading a hidden story written across your landscape. After a good rain, take a walk and observe where puddles form—these soggy spots might need amended soil or water-loving plants. Notice where water rushes away quickly, leaving thirsty patches that’ll need drought-tolerant varieties or extra mulch.
Grab a notebook and sketch these moisture zones onto your garden map using simple symbols. I like to use wavy lines for wet areas, dots for well-drained spots, and dashes for places that dry out fast. Pay attention to how slope affects drainage—even a gentle incline can create surprisingly different conditions just a few feet apart.
Shade also plays a sneaky role in moisture patterns. That shaded corner under your oak tree might stay damp for days, while a sunny slope dries out by noon. By mapping these patterns now, you’ll save yourself from the frustration of watching plants struggle in the wrong spot and instead match each plant to its perfect moisture niche.
Soil Variations: The Foundation Nobody Sees
Beneath your feet lies an invisible patchwork that profoundly affects what grows where. Soil variations across your property create distinct microclimates, even in modest gardens. You might have sandy, fast-draining soil near your driveway where builders brought in fill, while ten feet away, heavy clay holds moisture like a sponge.
These differences matter enormously. Sandy patches warm faster in spring and suit drought-tolerant plants, while clay areas stay cooler and wetter, perfect for moisture-lovers. Soil depth varies too—shallow soil over bedrock creates hot, dry conditions, while deeper pockets retain more water and nutrients.
Don’t overlook pH variations either. Areas under pine trees often become acidic, ideal for blueberries and azaleas, while spots near concrete foundations may be alkaline. Testing soil in multiple locations reveals these hidden patterns. Once you map these variations, you’ll understand why tomatoes thrive in one bed but languish in another. This knowledge transforms frustrating failures into informed planting decisions that work with your garden’s natural foundation.
Your Step-by-Step Garden Mapping Project
Gathering Your Simple Mapping Tools
Good news: you don’t need fancy equipment to create an accurate garden map! Start with graph paper or a simple notebook, which helps you sketch your space to scale. A measuring tape (even a 25-foot model works great) lets you record dimensions accurately. Your smartphone is perfect for snapping photos throughout the day to track sun and shade patterns.
Pick up an inexpensive outdoor thermometer to monitor temperature variations in different spots. A basic notebook becomes your observation journal for recording wind patterns, frost pockets, and moisture levels over time.
On a budget? Use free graph paper printables online, measure with string and a ruler, and track temperatures with a simple indoor-outdoor thermometer. Already have a gardening journal? Dedicate a section to your mapping notes. The key is consistency, not perfection. I started my first garden map using the back of an envelope and my daughter’s colored pencils—it worked beautifully and cost nothing! Choose tools that feel comfortable and encourage you to actually use them regularly.
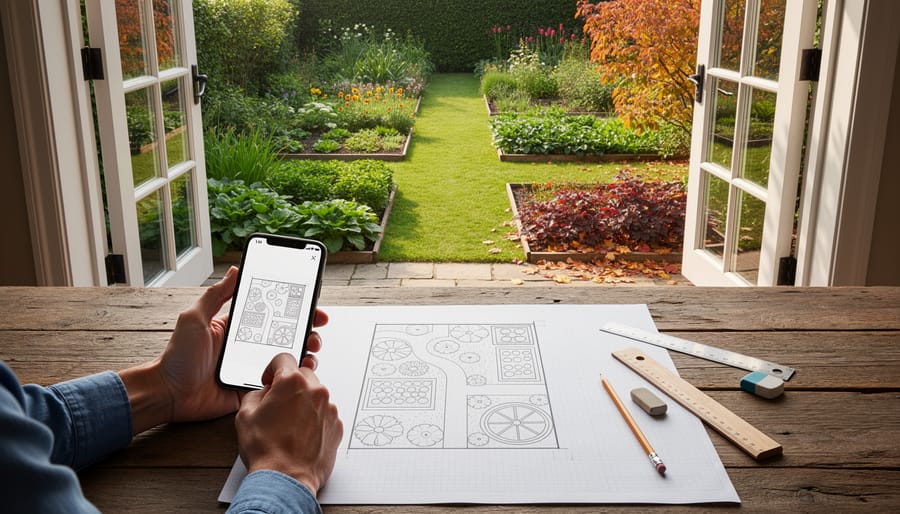
Creating Your Base Map
Start with a simple sketch or photograph of your garden from an overhead perspective. Don’t worry about artistic skill—this is a functional tool, not a masterpiece! Walk your garden with paper and pencil, or use your smartphone to capture the space.
Begin by marking the fixed elements that won’t change: your house, garage, sheds, patios, walkways, and driveway. These anchor points provide crucial reference for understanding how structures affect sunlight and wind patterns. Next, add established trees, large shrubs, and permanent fences. Note their approximate height, as this influences shade patterns throughout the day.
Include water sources like outdoor faucets and downspouts—you’ll thank yourself later when planning irrigation. Don’t forget utility areas like compost bins or tool sheds that might affect future planting decisions.
If sketching by hand, graph paper makes scaling easier, though rough proportions work perfectly fine. Digital enthusiasts might photograph their yard and sketch over the image using simple apps. The goal is creating a clear reference you can annotate as you observe your garden’s unique conditions over coming weeks.
Remember, this base map becomes your foundation for recording sun patterns, frost pockets, and moisture levels—all those microclimates that make certain spots perfect for tomatoes while others suit shade-loving hostas.
Observing and Recording Over Time
Your garden mapping journey truly begins when you commit to observing throughout the year. Think of it as getting to know a new friend—the more time you spend together, the more you understand their quirks and patterns.
Start with simple twice-daily checks during your first season. Walk your garden in early morning before the sun fully rises, noting which areas warm up first and where cool pockets linger. Return in late afternoon to see where shadows fall and which spots stay sunny longest. I like to bring my phone along to snap quick photos—these visual records become invaluable later.
Pay special attention after weather events. Following rainfall, observe where puddles form and which areas drain quickly. These wet spots might need better drainage or could be perfect for moisture-loving plants. In spring and fall, those first frost mornings are golden opportunities. Head out early to see where frost hits hardest and which areas stay protected. You’ll likely notice frost settles first in low-lying areas and open spaces, while spots near walls or under tree cover stay warmer.
Record your observations in a garden planning journal, noting dates, weather conditions, and specific locations. Even brief notes like “northwest corner holds frost until 10 AM” or “roses by fence get afternoon shade from maple tree” build a powerful knowledge base. Over one full growing season, these observations transform from random facts into a comprehensive understanding of your garden’s unique personality.
Adding Layers to Your Map
Once you’ve recorded your basic observations, it’s time to transform your map into a detailed microclimate guide. Think of this step as adding transparent sheets over your base map, each one highlighting a different aspect of your garden’s personality.
Start with color coding to represent sun exposure patterns. I like using yellow for full sun areas (six-plus hours), light green for partial shade (three to six hours), and dark green for full shade. You can use colored pencils directly on your map or create a digital version using free apps like Google Earth or garden planning software.
Next, add symbols for other crucial information. Draw wavy lines to indicate low-lying frost pockets where cold air settles. Use arrows to show prevailing wind direction and mark especially windy spots with double arrows. I remember being puzzled why my tomatoes struggled in one corner until I mapped the afternoon wind tunnel that was stressing them daily.
For moisture patterns, try dotted shading or simple symbols like water droplets for consistently damp areas and sun icons for dry spots. Don’t forget to note existing microclimates created by walls, fences, or large plants that provide shelter or reflected heat.
The beauty of layering is that you can see connections you’d otherwise miss. That shady, moist corner? Perfect for ferns. The sunny spot with afternoon wind protection? Your heat-loving peppers will thrive there. Your map becomes a personalized planting prescription.
Turning Your Map Into a Planting Strategy
Now that you’ve invested time in creating your garden map, let’s put it to work! This is where the real magic happens—transforming all those observations into a planting strategy that sets you up for success.
Start by reviewing your map with fresh eyes. Look at the different zones you’ve identified and think about what each area is really offering. That shady north-facing corner that frustrated you before? It’s actually perfect for hostas, ferns, and astilbes. The hot, dry spot near your driveway where nothing seemed to survive? That’s ideal territory for sedums, lavender, and other sun-loving, drought-tolerant plants.
Master gardener Ellen Rodriguez from Vancouver shared this approach with us: “I keep a simple chart matching my mapped zones to plant categories. Zone A gets my Mediterranean herbs, Zone B is for woodland natives, and so on. It sounds basic, but this system has completely eliminated my plant failures.” Her advice to work with nature rather than against it has transformed her garden into a thriving ecosystem.
Here’s a practical example: Let’s say your map shows a zone that gets morning sun but afternoon shade, with moderate moisture retention. This microclimate is fantastic for leafy greens, lettuces, and Asian vegetables—making it perfect for edible plant landscaping. Compare this to a full-sun zone with sandy soil and excellent drainage, which would be better suited to tomatoes, peppers, and Mediterranean herbs.
When selecting plants, consider starting with native plant selection for each zone. Native plants have evolved to thrive in your region’s specific conditions, making them naturally adapted to work within your microclimates. They typically require less water, fewer amendments, and minimal fussing once established.
Create a simple reference guide for yourself. List each mapped zone and note its key characteristics—sun exposure, moisture level, wind exposure, and soil type. Beside each zone, write plant categories that match those conditions. Keep this guide handy when you’re browsing nurseries or seed catalogs. It becomes your personal plant-matching tool, preventing impulse purchases that won’t thrive in your actual conditions.
Remember, your garden map isn’t a one-time project. As trees grow and structures age, microclimates shift. Review and update your map annually, and watch as your planting decisions become increasingly intuitive and successful.
Real Garden Wins: How Mapping Solved Common Problems
Let me tell you about Sarah from Oregon, who spent three frustrating seasons trying to grow tomatoes that never quite ripened. After mapping her garden’s microclimates, she discovered her tomato bed only received four hours of direct sun—not nearly enough. She relocated them to a south-facing spot near her garage that reflected extra heat, and that summer, she harvested bushels of perfectly ripe tomatoes. “I can’t believe I didn’t figure this out sooner,” she told me during a recent interview. “My map showed me exactly what I was doing wrong.”
Then there’s Marcus, a beginning gardener in Georgia who was watering his entire yard daily and still losing plants. His microclimate map revealed that the area under his oak tree stayed naturally moist while his exposed vegetable beds dried out quickly. By grouping plants according to water needs and adjusting his irrigation, he cut his water bill by 40 percent and stopped losing hostas to drought stress.
My favorite success story comes from Linda in Minnesota, who thought her growing season was limited to traditional timing. Her garden map showed a protected corner beside her house that stayed 10 degrees warmer than the rest of her yard. She started planting lettuce there three weeks earlier than recommended and extended her harvest well into November using the same spot.
These aren’t exceptional gardeners with special skills—they’re people just like you who took an afternoon to observe and document their garden conditions. The beauty of microclimate mapping is that it works for everyone, regardless of experience level. You’re simply learning what your garden is already telling you, then making informed decisions based on real conditions rather than guesswork. Once you see those patterns on paper, solutions that seemed impossible suddenly become obvious.
Garden mapping might sound like an ambitious project, but here’s the beautiful truth: you’re not trying to become a meteorologist or soil scientist. You’re simply getting to know your garden the way you’d get to know a new friend—by paying attention, noticing patterns, and understanding what makes it unique. This approach empowers you to work smarter, not harder, placing plants where they’ll naturally thrive instead of fighting against your garden’s personality.
The best part? You don’t need to map your entire garden in one weekend or invest in expensive equipment. Start with just one observation session. Grab a notebook, spend twenty minutes walking your space on a sunny afternoon, and jot down what you notice. Where does the light linger longest? Which spots feel noticeably cooler? That single session will already shift how you see your garden.
Remember, every thriving garden starts with understanding rather than assumptions. Your shady corner that frustrates you might be perfect for woodland natives. That hot, dry patch could become a stunning Mediterranean display. Garden mapping reveals these possibilities, transforming problem areas into opportunities.
So take that first observation walk this week. Notice, sketch, and start building your garden’s story. You’re not just mapping microclimates—you’re unlocking your garden’s potential and setting yourself up for seasons of success. Your plants will thank you, and you’ll wonder why you didn’t start sooner.